Spreadsheet Lesson Framework
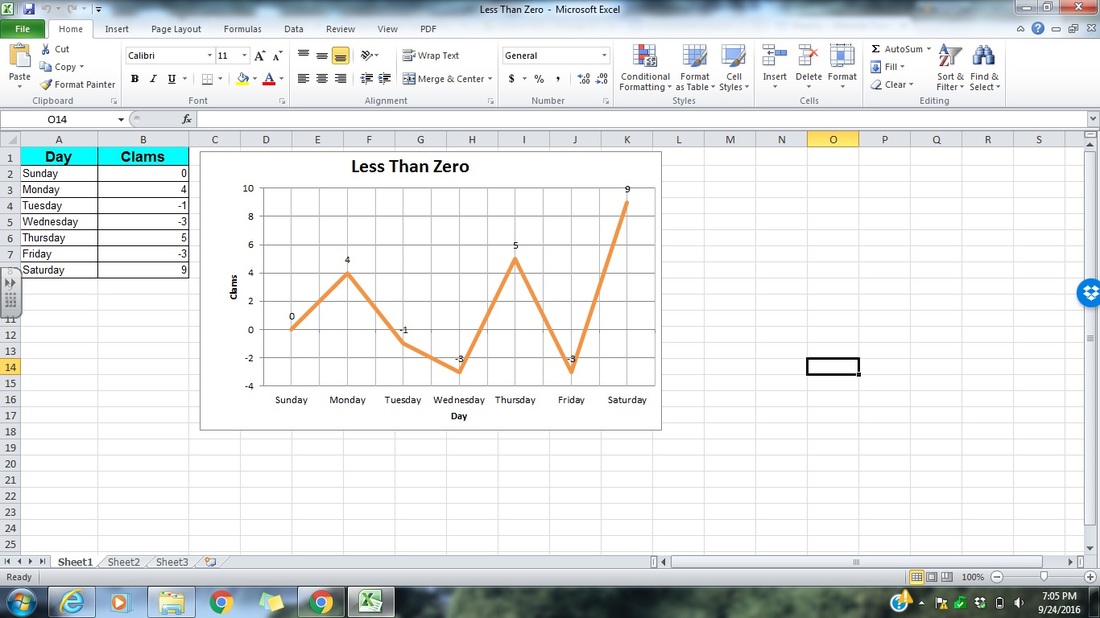
This page contains the framework for a lesson using Microsoft Excel with fourth graders. An example of the spreadsheet and line graph the students will create can be found below.
Topic Description: In this activity the students will listen to the library book, Less Than Zero by Stuart J. Murphy. Using the information from the book, the students will input the number of clams the penguin earned or spent into an Excel spreadsheet and use it to create and label a line graph with negative numbers.
Learning Goals:
Mathematics
Data: Throughout the story, the penguin earns and spends clams each day as he is saving up to buy a scooter. We will record the number of clams he has at the end of each day in the story. One column will be listed as Day. The second column will be listed as Clams. Each row will list the day of the week and the number of clams the penguin had at the end of each day.
A file and screen shot of the working spreadsheet can be found below.
Topic Description: In this activity the students will listen to the library book, Less Than Zero by Stuart J. Murphy. Using the information from the book, the students will input the number of clams the penguin earned or spent into an Excel spreadsheet and use it to create and label a line graph with negative numbers.
Learning Goals:
Mathematics
- Create a scaled line graph to represent a data set with several categories.
- Interpret information presented visually, orally, or quantitatively and explain how the information contributes to an understanding of the text in which it appears.
- Use computers and other kinds of technology to collect, organize, and communicate information and ideas.
- Connect knowledge and experiences from different subject areas.
- Develop, publish and present information in print and digital formats.
- Use productivity tools to produce content area assignments/projects.
- Adding and subtracting with negative numbers.
- Identifying when to use a line graph.
- Inputting information into a spreadsheet correctly.
- Labeling and formatting charts and graphs in Excel.
Data: Throughout the story, the penguin earns and spends clams each day as he is saving up to buy a scooter. We will record the number of clams he has at the end of each day in the story. One column will be listed as Day. The second column will be listed as Clams. Each row will list the day of the week and the number of clams the penguin had at the end of each day.
A file and screen shot of the working spreadsheet can be found below.
| less_than_zero.xlsx |